Looking forward to being back in the incredibly inspiring environment that is ITP – NYU this week!
Last week, I attended a Maptime NYC meetup where Adam Pearce (developer at Bloomberg) walked me through animating with D3.js, and in consequence, improved my understanding of D3 100 million times over. It’s been a slog teaching myself JavaScript and D3 this summer solely through readings, altering code and the occasional Meetup. Having someone explain concepts while working on code was incredibly helpful, and the D3 documentation is making much more sense now.
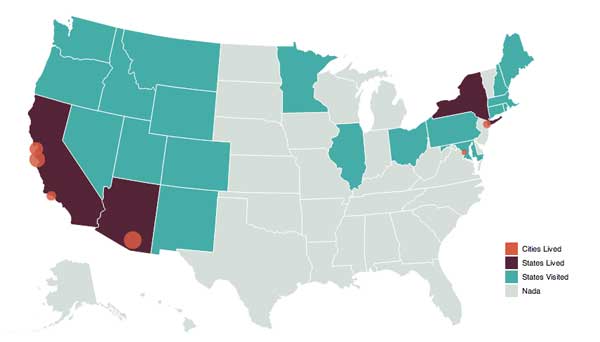
Here is a US map of my travels created in July using D3:
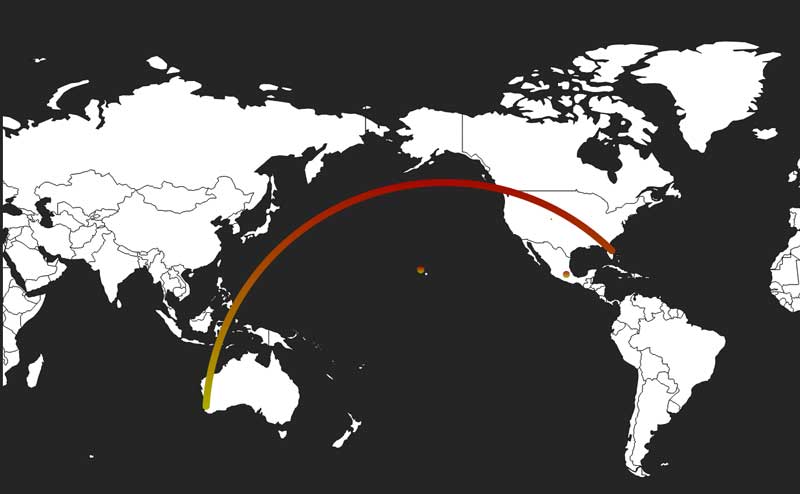
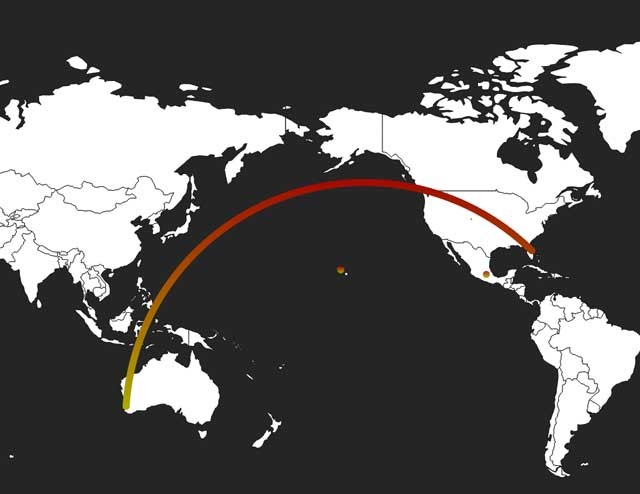
 And a world map with an arc animation effect to connect locations created just last week at Maptime NYC:
There are TONS of resources for learning how to make maps including Mike Bostock’s incredible tutorials, documentation and examples (pretty much everything you can think of to make with D3.js, Mike has made, and nicely coded up for you), meetups including Maptime and GeoNYC, and Scott Murray’s Interactive Data Visualization for the Web.
Looking forward to hopefully finishing these “summer” projects soon, and starting new ones this upcoming semester!