Last step before finishing my Star Trails music visualization is getting the colors right. First step in experimenting has been moving away from the RGB color space and thinking in terms of Hue, Saturation and Brightness.
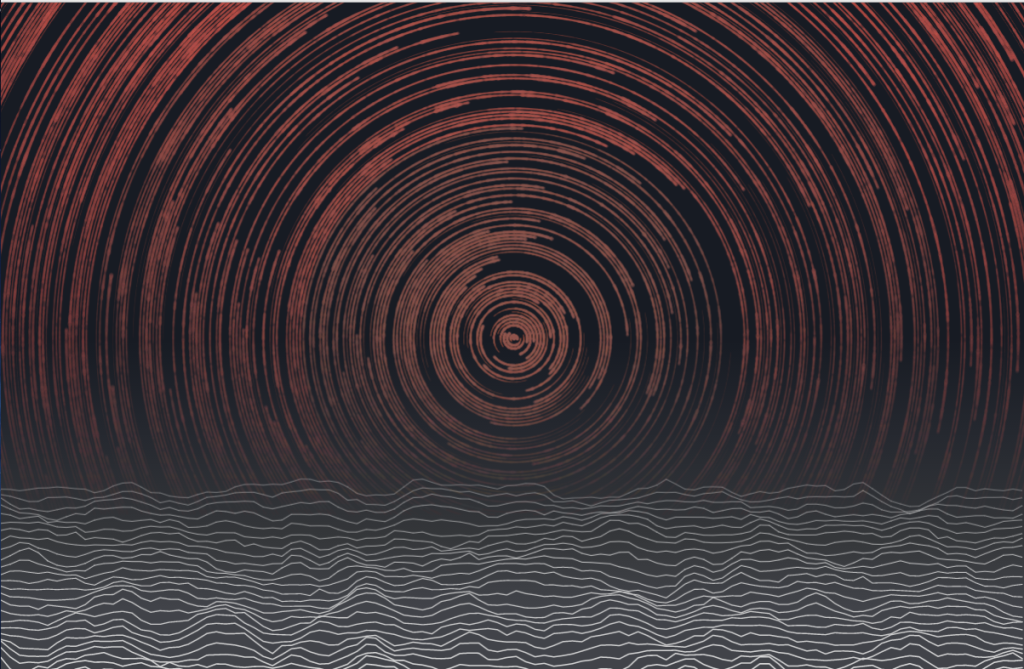
Low frequency values mapped to center, higher values mapped to outer edge
The challenge is in understanding how the music data is affecting the color mapping. Right now, I have only been able to create a monochrome looking sky, when I would rather have more variation in colors. Part of the reason for the monochrome look at present is that the frequency values are mapped to the x axis so that low frequency values are nested in the center and get higher as move outward. Each star represents a different frequency value (low, mid, high). It might be better though to randomly draw the different values in order to result in a more varying sky. It is also possible that because the song being visualized does not change so much, there is less visual variation.
I need to get in the habit of console logging my sketch to make sense of what is going on. Once the colors are closer to where I want them to be for the sky, I will map colors for the landscape lines as well. Right now, the landscape and sky read as two separate visuals rather than being part of the same sketch.
This project has been an ongoing enormous endeavor but thankfully, the visual look of its has vastly improved over the past week now that I am experimenting with hue, saturation, and brightness!

