For the Cloud Commuting Midterm, Jiwon, Haylee and I analyzed CitiBike in order to identify communities of stations based on number of trips between stations. By analyzing bike trips between stations, would we discover a pattern of stations connected to each other due to a high volume of trips between them, and what would this pattern reveal about current usage of the CitiBike system?
To identify “CitiBikeHoods”, we wrote a Python program to calculate number of bike trips between stations from August 2014 (the most recent data available to us.) Thanks to Salem Al-Mansoori for helping us write this program (code at end of post!)
Once we had our data, we imported to Gephi, which is a software program which created a Network Graph of the stations and identified communities of stations. Initially, we were hoping to write a program using a Python module called NetworkX in order to create the network graph (allows for more control in generating graph and identifying communities from the data), but we had trouble writing the program so opted to use Gephi.
The tricky part of importing our data to Gephi was giving the data to Gephi in a format Gephi liked. We had to rename our Origin Station and Destination Station columns (our nodes), “Source” and “Target” and the column containing the number of bike trips between the stations we renamed “Edge” since it would be the weight of the line connecting our nodes (stations!) We used a Network Graph to identify relationships between stations by grouping them into modules or “hoods.”

In the above graph, the outer yellow nodes are Brooklyn stations, the stations in the center are located in Lower Manhattan, the green stations are Midtown stations, the lower purple stations are Lower East Side/East Village while the upper purple stations are Murray Hill/FlatIron.
We then exported this data from Gephi in order to create a map using Mapbox to color in the stations according to the community the station belonged to. We chose to go with 63 communities but it might be better in the future to have less communities. View the code here. (Thanks to Adarsh Kosaru for helping us write code to color in our different communities with a randomly generated color in MapBox!)

What was immediately obvious in the mapping of communities was that Midtown is treated as one neighborhood, along with Brooklyn and Lower East Side, while other groupings of stations appeared to be random. In order to better understand the CitiBikeHoods, we compared to other maps of New York City.
CitiBikeHoods and Zoning Districts

We found a map of the commercial and residential zones of NYC. In the above map, red areas are office buildings, blue areas are residential, and purple areas are mixed residential/commercial. From this, we were able to understand that people who live in Lower East Side in condos possibly use CitiBike to commute to work in Lower Manhattan. CitiBike users who lives in Chelsea also potentially use CitiBike to commute to Lower Manhattan as well. CitiBike users who live in residential areas of Midtown (far West and East side) most likely use CitiBike to make cross town trips (East-West) to office buildings.
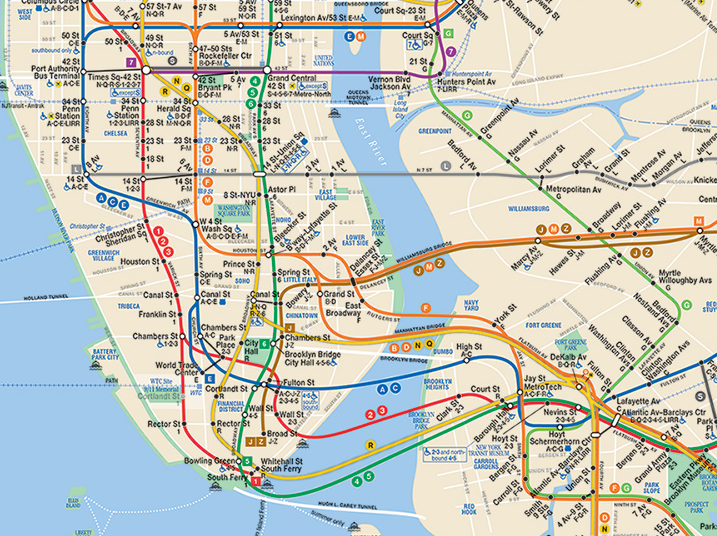
CitiBikeHoods and the Subway System

CitiBike users who live on edge of Manhattan (far East/West side) use CitiBike because they are not close to public transit. Since public transit is mainly North-South, we believe some trips are cross town rather than taking a bus East-West. CitiBike users who take New Jersey Path train use CitiBike to commute to Financial District. Many of the trips seem to be commuters going from Financial to residential/mixed-use neighborhoods (Chelsea, Soho) and vice versa. CitiBike users who live in Midtown most likely also work in Midtown and make most of their trips in Midtown area
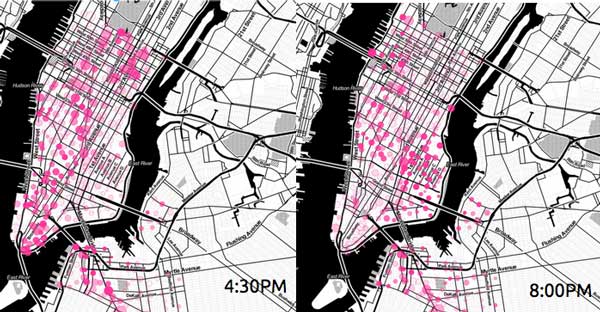
CitiBikeHoods and Dock Availability from Sept 30, 2014
Morning Commute Dock Availability

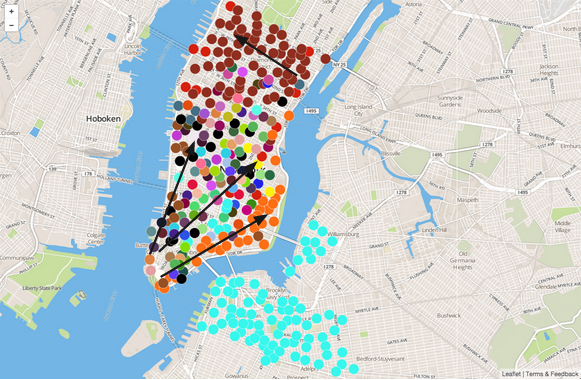
Directionality of Morning Commute Based on CitiBikeHoods

CitiBike users who live in Lower East Side, Chelsea, and East Village commute to Financial District/Lower Manhattan. Some CitiBike users who live in Financial District do reverse commute. CitiBike users who live in Clinton Hill/Fort Greene, Brooklyn commute to Williamsburg or Downtown Brooklyn. CitiBike users who live in Midtown (far East/West side) commute to office buildings in the middle of Midtown.
Evening Bike Availability
 Directionality of Evening Commute Based on CitiBikeHoods
 Evening commute pattern seems more straightforward with users who live in Financial District biking home to Lower East Side/East Village/Chelsea and those who work in Midtown biking back to West side of Midtown. Less obvious if there is a marked pattern in Brooklyn.
Conclusion
A surprising amount can be learned about the CitiBike system by grouping bike stations into communities and comparing to information about NY neighborhoods, public transit, residential and commercial districts and bike availability at different times of day.
For next steps, we should look at a longer time frame (many months), and confirm commute directionality between stations. Perhaps we can use NetworkX over Gephi to see if the communities generated are different than the Gephi software created (would have more control, and can use different algorithms). What are ways this information could be used to self-organize CitiBike?
Lastly, is 63 communities too much? Would we learn more from less communities/groupings?
CSV Python Count Code:
1 2 3 4 5 6 7 8 9 10 11 12 13 14 15 16 17 18 19 20 21 22 23 24 25 26 27 28 29 30 31 32 33 34 35 36 37 38 39 40 41 42 43 44 45 46 47 48 49 50 51 52 53 54 55 56 |
import csv stationcounter = {} rowindex = 0 #skip the header row with open('august2014.csv', 'rU') as csvfile: csvreader = csv.reader(csvfile, quotechar = '"', dialect=csv.excel) for row in csvreader: if row == 0: #skipping header row row += 1 continue else: #get first station name originstation = row[4] #print "origin station: " + row[0] #get second station destinationstation = row[8] #construct a combination name: station1-station2 comboname1 = originstation + "-" + destinationstation #print comboname1 #also construct another combintation name to be searched in the dictionary: station2-station1 comboname2 = destinationstation + "-" + originstation #checking both combination names in the dictionary #and incrementing the value if the combo name exist as a key #otherwise create a new entry if comboname1 in stationcounter: currentcounter = stationcounter[comboname1] currentcounter += 1 stationcounter[comboname1] = currentcounter elif comboname2 in stationcounter: currentcounter = stationcounter[comboname2] currentcounter += 1 stationcounter[comboname2] = currentcounter else: stationcounter[comboname2] = 1 #c = csv.writer(open("stationcount.csv"), "wb") with open('stationcount.csv', 'wb') as test_file: csv_writer = csv.writer(test_file) for key in stationcounter: value = stationcounter[key] #csv_writer.writerow([key, ": ", value]) #csv_writer.writerow([stationname, key, value]) csv_writer.writerow([key, value]) #print key + ": " + str(value) |